Tellfy offers you a series of analytics to obtain relevant information about what is happening in our communities.
With all this information you can see the growth of your communities, know who are the most active users and groups, how your users are segmented, see where they write to you from and many other interesting things. In this article we will review everything you can get when you create your Tellfy community. Are you ready? … Well, let’s go there!
Numerical metrics
The numerical metrics give summary information of what happens in your communities. In this way with a single glance you have metrics of the status of your communications.
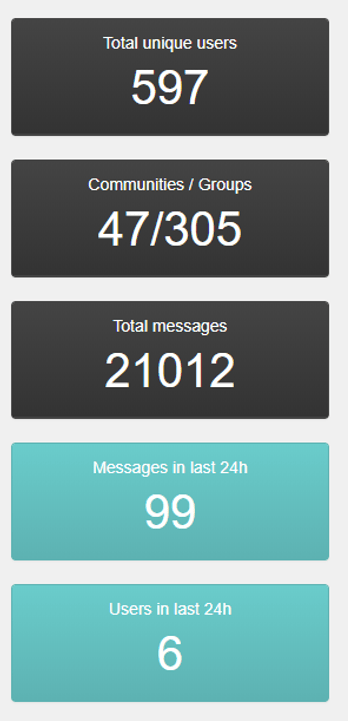
Total number of users
This box shows the total number of users in your communities. If you click on this box, you will access the users section.
Communities/Groups
Here you specify the number of communities and groups you have in total. By clicking on the box we will go to the analysis of communities and groups.
Total number of messages
How many communications there are between all your communities and groups.
Messages in the last 24 hours
How many communications have been in your communities on the last day.
Users in the last 24 hours
Here is the number of users, unique, who have written a message in the last 24 hours.
Active users
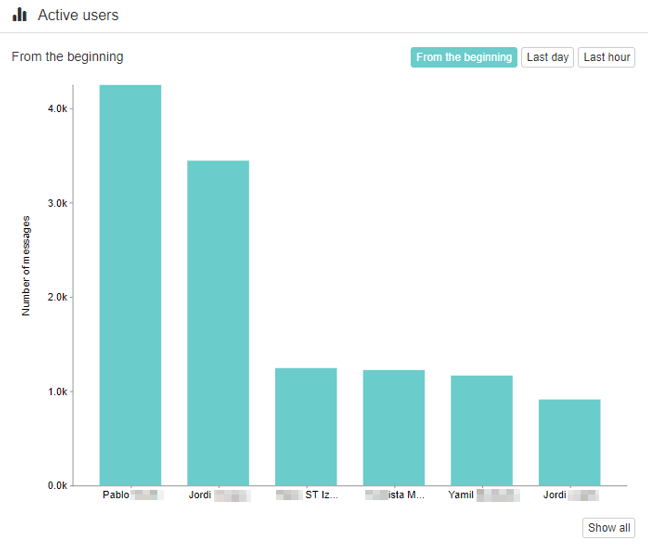
In this bar chart you can see which of your users are the most active, showing the number of messages they have sent in a specific time interval. You can choose between the messages sent in the last hour, the day before or from the creation of your communities. Only the 6 most active users are shown in the default view, although you can see all users by clicking on the “Show all” button to see the full list of users who have sent some communication in the selected interval .
More active groups
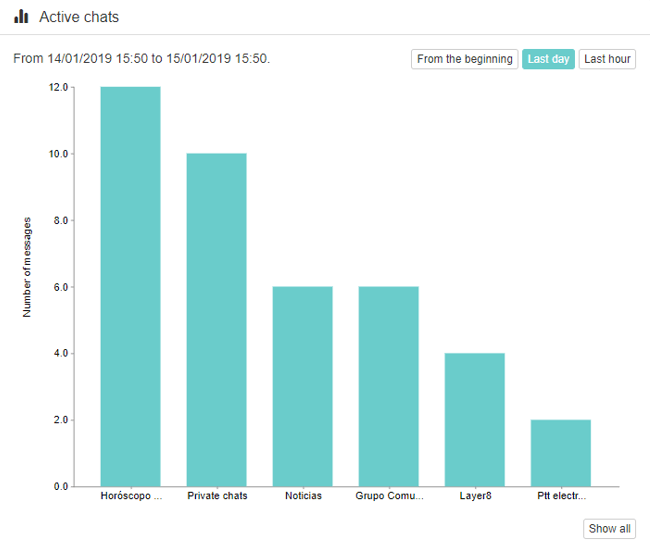
In this graphic you can see which of your groups are more active, showing the number of messages that have been sent in a specific time interval. You can choose between the messages sent in the last hour, the previous day or since the creation of your groups. Only the 6 most active groups are shown in the default view, although you can see all the groups by clicking on the “Show all” button to see the complete list of groups where communications have been sent in the selected interval.
Users activity
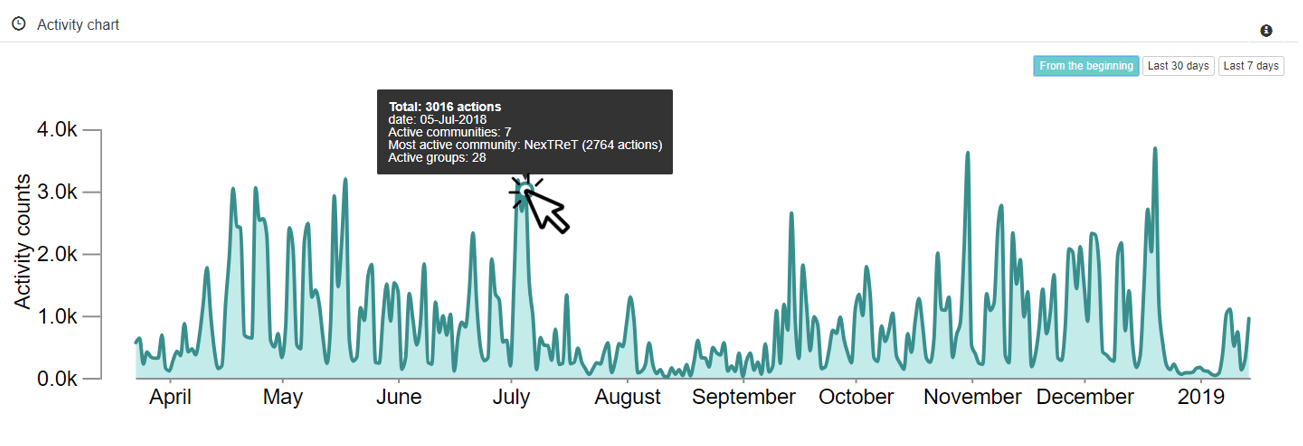
The activity is defined as any action that is carried out in the community or in a group such as consulting the number of users, writing a message, that a user changes the nickname (‘nickname’), etc …
In this graph you can see the activity in the communities and groups over time. If we hover over the peaks, we can see more information about this particular day, such as the number of activities that took place, the number of communities in which there was activity, the most active community and the total number of active groups .
Activity heat map
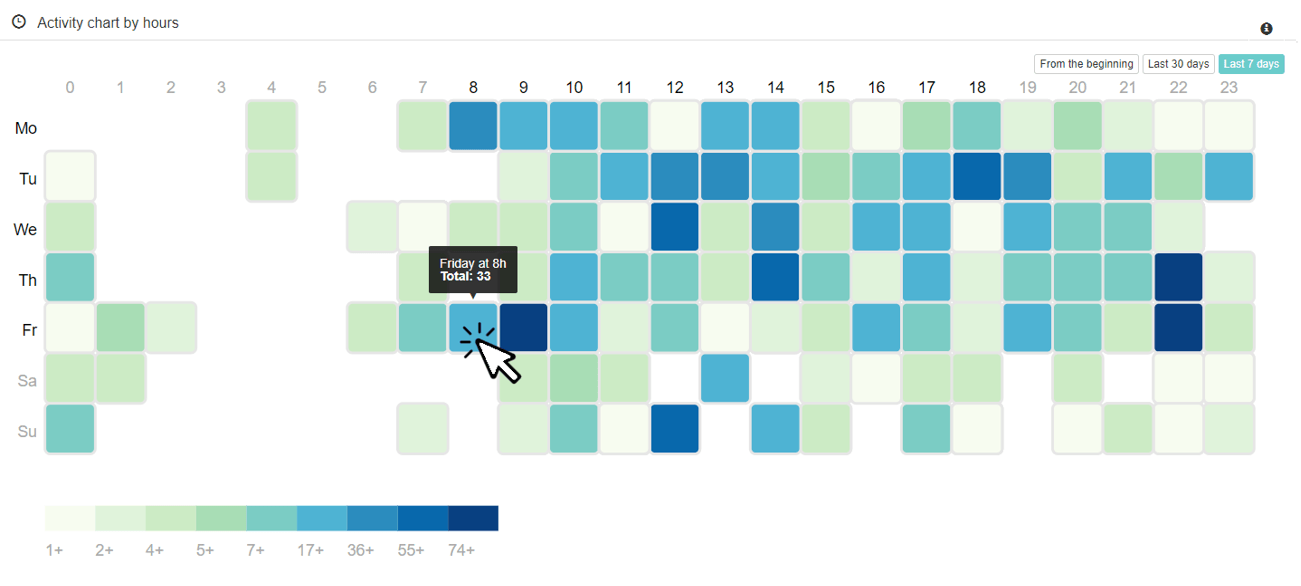
In order to know what times and days there is more activity in the communities we provide you with this heat map. There we show you in a darker color the days of the week and hours where there has been a greater number of activities. Data from the last week, last 30 days (1 month) or from the beginning can be displayed.
You can go over each box to see more data.
An important fact. The schedules are taking as reference the time of Spain (GMT + 1 or GMT + 2 depending on whether we are in winter or summer). That is, if you are in Portugal, consider that your data corresponds to one hour less than what is shown here.
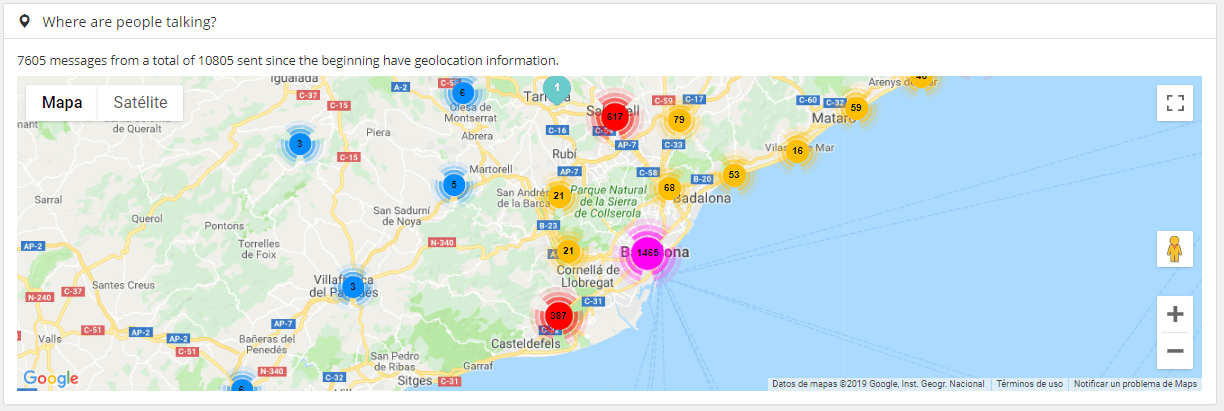
Geolocation of communications
Tellfy facilitates the geolocation of the communications that are generated, provided that the users of your community have allowed access to their location. In this way you can see where users are sending messages in your groups, all maintaining and preserving their total privacy.
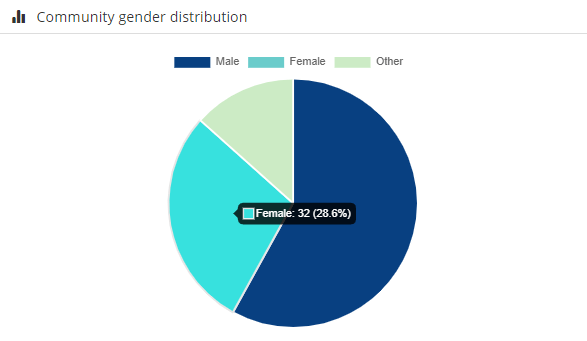
Gender segmentation
You can know how your community and groups are segmented by gender. Filter at the community or group level to know the distribution by gender.
Many more analytics!
You have at your disposal many other analytics available, such as the detection of the language they use in your groups, the survey analytics that is capable of geolocating the results or the graph of communicative behavior.
Create your community in Tellfy and discover them all. Once you have created your community, contact us and ask us for access to analytics so that we can facilitate it.